To view the domain report, click the  Report icon on the Domain administration page. The report will open, giving you access to miscellaneous statistical data.
To get a printer-friendly version of report, use the  icon.
icon.
To send the report by e-mail, enter the email address into the input field and click the  icon.
icon.
To view the traffic history, click the  Traffic History icon.
To view the statistics on traffic used by the domain services, click  Traffic.
To view the hits statistics, select the  Web Stats icon or
  Web Stats SSL icon.
To view the FTP server statistics, use the  FTP Stats icon. To view the information on anonymous FTP, use
  Anon.FTP Stats.
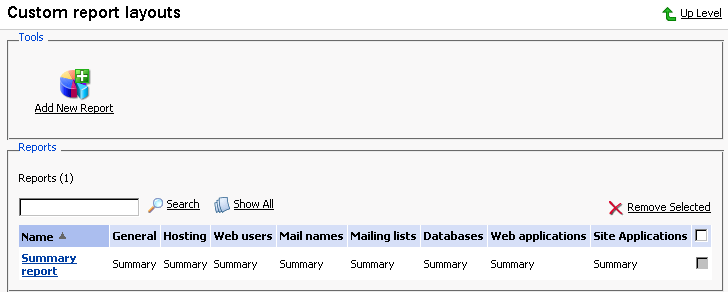
You can define which sections of the domain report will be displayed. To this effect, on the domain report page, click the  Customize icon. The Custom report layouts page will open displaying the list of currently existing report layouts:

To add a new custom layout, follow these steps:
Click the
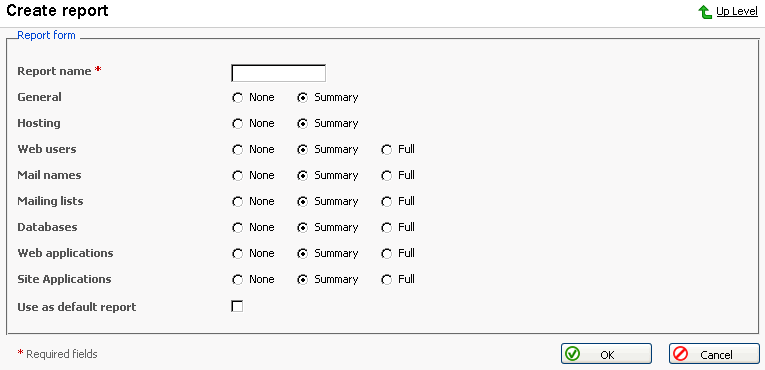
 Add New Report icon. The page appears:
Enter the report layout name in the Report name field.
For each section of the report, define the amount of data that will be presented.
To use this layout by default, select the corresponding checkbox.
Click OK.
To remove a custom report layout, select it using the corresponding checkbox, and click Remove Selected.
To edit a custom layout, select its title in the list.